Vibe coding vs. classical coding a YARP reverse proxy
Comparing two coding approaches on the case of a custom YARP reverse proxy
The goals
There has been a lot of hype about vibe coding lately, so I wanted to try it out, and see how it stacks up against a traditional coding approach.
While working with a custom reverse proxy at Caspeco AB, I became interested in reverse proxies in general. I wanted to try building my own from scratch. Since I mostly work in .NET, I chose YARP, the go-to reverse proxy library for .NET.
I therefore decided to write two custom reverse proxies. The first I would “vibe-code” (LLM-assisted), and the second would be written the old-fashioned way — entirey by hand.
As a bonus, I also decided to set up monitoring for my reverse proxies using Prometheus and Grafana, two popular open-source monitoring tools.
Architecture
A reverse proxy needs backend services to forward requests to. I built one backend service, but ran two containers of it, giving me two services to proxy requests to. I also spun up Prometheus and Grafana containers. The docker-compose.yml file shows the project architecture:
1
2
3
4
5
6
7
8
9
10
11
12
13
14
15
16
17
18
19
20
21
22
23
24
25
26
27
28
29
30
31
32
33
34
35
36
37
38
39
40
41
42
43
44
45
46
47
48
49
50
51
52
53
54
55
56
57
58
59
60
61
62
63
64
65
66
67
68
69
70
71
72
73
74
75
76
77
78
79
80
services:
  product-service-a:
    build:
      context: .
      dockerfile: src/Services/ProductService/ProductService.Api/Dockerfile
    ports:
      - "5001:8080" # Host:Container. 8080 is the default HTTP port for .NET 8+ aspnet images
    environment:
      - ASPNETCORE_ENVIRONMENT=Development
      - ASPNETCORE_HTTP_PORTS=8080 # Explicitly set container HTTP port

  product-service-b:
    build:
      context: .
      dockerfile: src/Services/ProductService/ProductService.Api/Dockerfile
    ports:
      - "5011:8080" # Host:Container. 8080 is the default HTTP port for .NET 8+ aspnet images
    environment:
      - ASPNETCORE_ENVIRONMENT=Development
      - ASPNETCORE_HTTP_PORTS=8080 # Explicitly set container HTTP port

  postgres-db:
    image: postgres:15-alpine # Using PostgreSQL version 15 on Alpine Linux for a smaller image
    container_name: yarp_postgres_db # Optional: give the container a specific name
    environment:
      POSTGRES_USER: yarpuser        # Define the default superuser for the database
      POSTGRES_PASSWORD: yarpPassword  # Define the password for the superuser
      POSTGRES_DB: yarp_routing_db   # Optional: Creates this database automatically on first run
    ports:
      - "5432:5432" # Map host port 5432 to container port 5432 (default PostgreSQL port)
    volumes:
      - postgres_data:/var/lib/postgresql/data # Persist database data
    restart: unless-stopped # Optional: restarts the DB container if it stops, unless manually stopped

  gateway-api:
    build:
      context: .
      dockerfile: src/ManualGateway/ManualGateway.Api/Dockerfile
    ports:
      - "5012:8080" # YARP gateway will be accessible on host port 5012
    environment:
      - ASPNETCORE_ENVIRONMENT=Development
      - ASPNETCORE_HTTP_PORTS=8080 # Gateway container listens on 8080
    depends_on: # Good practice: ensure backend services start first
      - product-service-a
      - product-service-b
      - postgres-db

  prometheus:
    image: prom/prometheus:latest
    container_name: prometheus
    ports:
      - "9090:9090"
    volumes:
      - ./monitoring/prometheus.yml:/etc/prometheus/prometheus.yml # Bind mounts the config file into the container
      - prometheus_data:/prometheus # Named volume to persist metrics data
    command:
      - '--config.file=/etc/prometheus/prometheus.yml'
      - '--storage.tsdb.path=/prometheus'
      - '--web.console.libraries=/etc/prometheus/console_libraries'
      - '--web.console.templates=/etc/prometheus/consoles'
    restart: unless-stopped

  grafana:
    image: grafana/grafana-enterprise
    container_name: grafana
    ports:
      - "3000:3000"
    volumes:
      - grafana_data:/var/lib/grafana
    environment:
      - GF_SECURITY_ADMIN_PASSWORD=admin
    restart: unless-stopped
    depends_on:
      - prometheus

volumes:
  postgres_data: # This named volume will store the PostgreSQL data
  prometheus_data: # This named volume will store the Prometheus metrics data
  grafana_data: # This names volume will store the Grafana data
I included a postgres-db container so I could read service deployments from a database, enabling dynamic routing.
Product service
This is a classic Domain-Driven Design (DDD) backend service, structured as follows:
Domain (business logic) → Infrastructure (data access) → Application (application logic) → API (exposes the application)
I won’t go into detail about Domain-Driven Design here—there are better resources available. In short: you define the aggregate root and the contract for accessing and modifying it. Then, you implement methods for operating on the aggregate root. Next, you add layers for data transfer (DTOs) and methods that call repositories and transform data as needed. Finally, the API layer exposes these methods.
Method of implementation
I vibe-coded this part and didn’t write most of the code myself, except for small changes and adjustments. The reason for this is that the goal of the project was to learn about YARP and to compare a vibe-coded reverse proxy to a manually-coded reverse proxy. The backend service was just a “necessary evil”.
YARP
I started by asking: Why is it called a “reverse” proxy? After some research, I learned:
There are traditional proxies (forward proxies) and reverse proxies. A forward proxy sits in front of a client and forwards its requests to the internet. A reverse proxy sits in front of a server and handles requests coming from clients.
The typical flow looks like this:
[Client] ⇄ [Forward Proxy] ⇄ [Internet] ⇄ [Reverse Proxy] ⇄ [Backend Server]
Vibe coding
I vibe-coded the reverse proxy by querying an LLM, mostly Gemini 2.5 Pro in Cursor. I was pleasantly surprised to get a working version, though it felt complicated. Since I vibe-coded the proxy first and only later implemented one by hand, I wasn’t sure exactly why it felt awkward and bloated. You be the judge:
1
2
3
4
5
6
7
8
9
10
11
12
13
14
15
16
17
18
19
20
21
22
23
24
25
26
27
28
29
30
31
32
33
34
35
36
37
38
39
40
41
42
43
44
45
46
47
48
49
50
51
52
53
54
55
56
57
58
59
60
61
62
63
64
65
66
67
68
69
70
71
72
73
74
75
76
77
78
79
using System.Diagnostics;
using Gateway.Api.Services;
using Yarp.ReverseProxy.Forwarder;
using System.Net;

var builder = WebApplication.CreateBuilder(args);

builder.Configuration.AddJsonFile("yarp.json", optional: false, reloadOnChange: true);
builder.Services.AddReverseProxy()
    .LoadFromConfig(builder.Configuration.GetSection("ReverseProxy"));
builder.Services.AddScoped<SystemRoutingRepository>();
builder.Services.AddHttpForwarder();

var app = builder.Build();

var httpClient = new HttpMessageInvoker(new SocketsHttpHandler()
{
    UseProxy = false,
    AllowAutoRedirect = false,
    AutomaticDecompression = DecompressionMethods.None,
    UseCookies = false,
    ActivityHeadersPropagator = new ReverseProxyPropagator(DistributedContextPropagator.Current),
    ConnectTimeout = TimeSpan.FromSeconds(15),
});

var forwarder = app.Services.GetRequiredService<IHttpForwarder>();
var loggerFactory = app.Services.GetRequiredService<ILoggerFactory>();
var logger = loggerFactory.CreateLogger("DynamicProductRouting");

app.Map("/products-api/{**rest}", async (HttpContext httpContext, string rest) =>
{
    if (!httpContext.Request.Query.TryGetValue("system", out var systemIdValues) || string.IsNullOrEmpty(systemIdValues.FirstOrDefault()))
    {
        logger.LogInformation("Product route: 'system' query parameter missing or empty. Falling back to static YARP config.");
        httpContext.Response.StatusCode = StatusCodes.Status400BadRequest;
        await httpContext.Response.WriteAsync("The 'system' query parameter is required for this product API endpoint.");
        return;
    }

    var systemId = systemIdValues.First();
    var routingRepo = httpContext.RequestServices.GetRequiredService<SystemRoutingRepository>();
    logger.LogInformation("Product route: Attempting dynamic route for systemId '{SystemId}' and path '/{Rest}'", systemId, rest);

    var systemRoute = await routingRepo.GetRouteBySystemIdAsync(systemId!);
    if (systemRoute == null || string.IsNullOrEmpty(systemRoute.ProductServiceTarget))
    {
        logger.LogWarning("Product route: No specific route found for systemId '{SystemId}' in database, or ProductServiceTarget is missing.", systemId);
        httpContext.Response.StatusCode = StatusCodes.Status404NotFound;
        await httpContext.Response.WriteAsync($"No product routing configuration found for system '{systemId}'.");
        return;
    }

    var productRoute = systemRoute.ProductServiceTarget;
    logger.LogInformation("Product route: Forwarding to '{SystemRoute}/{Rest}' for systemId '{SystemId}'", productRoute, rest, systemId);

    var backendPath = $"/{rest}{httpContext.Request.QueryString}";
    var targetUri = $"{productRoute}{backendPath}";
    logger.LogInformation("Product route: Constructed Target URI '{TargetUri}'", targetUri);

    var error = await forwarder.SendAsync(httpContext, targetUri, httpClient);
    if (error != ForwarderError.None)
    {
        var errorFeature = httpContext.GetForwarderErrorFeature();
        var exception = errorFeature?.Exception;
        logger.LogError(exception, "Product route: Error forwarding request for systemId '{SystemId}'. Error: {ForwarderError}", systemId, error);
        if (!httpContext.Response.HasStarted)
        {
            httpContext.Response.StatusCode = StatusCodes.Status502BadGateway;
            await httpContext.Response.WriteAsync("Error forwarding request to backend product service.");
        }
    }
    else
    {
        logger.LogInformation("Product route: Successfully forwarded request for systemId '{SystemId}' to '{TargetUri}'", systemId, targetUri);
    }
});

app.MapReverseProxy();
app.Run();
Classical coding
I then decided to implement a reverse proxy by writing it myself. I started by reading about reverse proxies in general, then the YARP documentation, and finally code samples from the official YARP repo.
Here’s what I learned:
- There are two ways to provide routing logic: configuration files and code.
- You can route requests in many ways—by headers, queries, cookies, etc.
- The most native way to achieve programmatic routing is to modify YARP’s built-in pipeline with custom middleware.
The last point became clear when I looked at a code sample from YARP’s official repo, which shows how to programmatically create routes and destinations in code. The example also shows how to modify YARP’s proxy pipeline with custom middleware. So, for my custom implementation I tried to achieve something very similar:
1
2
3
4
5
6
7
8
9
10
11
12
13
14
15
16
17
18
19
20
21
22
23
24
25
26
27
28
29
30
31
32
33
34
35
36
37
38
39
40
41
42
43
44
45
46
47
48
49
50
51
52
53
54
55
56
57
58
59
60
61
62
63
64
65
66
67
68
69
70
71
72
73
74
75
76
77
78
79
80
81
82
83
84
85
86
87
88
89
90
91
92
93
94
95
96
97
98
99
100
101
102
103
104
105
106
107
108
109
110
111
112
113
114
115
116
117
using ManualGateway.Api.Services;
using Prometheus;
using Yarp.ReverseProxy.Configuration;
using Yarp.ReverseProxy.Model;

var builder = WebApplication.CreateBuilder(args);

builder.Configuration.AddJsonFile("yarp.json", optional: false, reloadOnChange: true);
builder.Services.AddControllers();
builder.Services.AddReverseProxy()
    .LoadFromConfig(builder.Configuration.GetSection("ReverseProxy"))
    .LoadFromMemory([], []);
builder.Services.AddScoped<SystemRoutingRepository>();

var app = builder.Build();

// At startup (before any HTTP requests), there's no active scope. Scoped services can only be resolved
// within an active scope context.
using (var scope = app.Services.CreateScope())
{
    var repository = scope.ServiceProvider.GetRequiredService<SystemRoutingRepository>();
    var initialRoutes = GetRoutesFromDatabase();
    var initialClusters = await GetClustersFromDatabase(repository);

    var configProvider = app.Services.GetRequiredService<InMemoryConfigProvider>();
    configProvider.Update(initialRoutes, initialClusters);
}

app.Map("/update", async context =>
{
    var repository = context.RequestServices.GetRequiredService<SystemRoutingRepository>();
    var routes = GetRoutesFromDatabase();
    var clusters = await GetClustersFromDatabase(repository);
    context.RequestServices.GetRequiredService<InMemoryConfigProvider>().Update(routes, clusters);
});
// We can customize the proxy pipeline and add/remove/replace steps
app.MapReverseProxy(proxyPipeline =>
{
    // Use a custom proxy middleware, defined below
    proxyPipeline.Use(MyCustomProxyStep);
    // Don't forget to include these two middleware when you make a custom proxy pipeline (if you need them).
    proxyPipeline.UseSessionAffinity();
    proxyPipeline.UseLoadBalancing();
});

// Use and send metrics to Prometheus
app.UseHttpMetrics();
app.MapMetrics();

app.Run();

RouteConfig[] GetRoutesFromDatabase()
{
    return
    [
        new RouteConfig
        {
            RouteId = "product-route",
            ClusterId = "product-cluster",
            Match = new RouteMatch
            {
                Path = "/api/products/{**catch-all}"
            }
        }
    ];
}

async Task<ClusterConfig[]> GetClustersFromDatabase(SystemRoutingRepository repository)
{
    var systemRoutes = await repository.GetAllRoutesAsync();
    var destinations = new Dictionary<string, DestinationConfig>(StringComparer.OrdinalIgnoreCase);

    foreach (var systemRoute in systemRoutes)
    {
        destinations.Add(
            $"product-dest-{systemRoute.SystemId}",
            new DestinationConfig { Address = systemRoute.ProductServiceTarget }
        );
    }

    return
    [
        new ClusterConfig()
        {
            ClusterId = $"product-cluster",
            Destinations = destinations
        }
    ];

}

/// <summary>
/// Custom proxy step that filters destinations based on a header in the inbound request
/// </summary>
Task MyCustomProxyStep(HttpContext context, Func<Task> next)
{
    // Can read data from the request via the context
    var destinationHeaderPresent = context.Request.Headers.TryGetValue("destination", out var headerValues) && headerValues.Count == 1;
    var destination = headerValues.FirstOrDefault();

    // The context also stores a ReverseProxyFeature which holds proxy specific data such as the cluster, route and destinations
    var availableDestinationsFeature = context.Features.Get<IReverseProxyFeature>();

    if (!destinationHeaderPresent || destination is null || availableDestinationsFeature is null)
    {
        context.Response.StatusCode = 400;
        context.Response.WriteAsync("Destination header not present. Cannot route the request.");
        return Task.CompletedTask;
    }
    var filteredDestinations = availableDestinationsFeature.AvailableDestinations
        .Where(d => d.DestinationId.Contains(destination)).ToList();

    availableDestinationsFeature.AvailableDestinations = filteredDestinations;

    // Important - required to move to the next step in the proxy pipeline
    return next();
}
Comparing the Implementations: Vibe-Coding vs. Classical Coding
The vibe-coded version, generated mostly by an LLM, ended up being more complicated than necessary. It relied heavily on manual forwarding logic and custom handlers for each route, rather than leveraging YARP’s built-in configuration and middleware pipeline. The code was simply less idiomatic use of YARP. In contrast, the hand-coded version uses YARP’s configuration and pipeline features, resulting in much cleaner code. By relying on YARP’s built-in mechanisms, the hand-coded approach is more flexible and robust. It’s easier to add new routing logic, or update the proxy’s behavior as requirements change.
Conclusion
In this project, I built two custom reverse proxies with YARP. The first was vibe-coded; the second I coded myself after reading the YARP documentation and official code examples. Manual coding produced a more performant, idiomatic YARP reverse proxy, and resulted in a deeper understanding of the code. Vibe coding produced a working reverse proxy, albeit written in code that was less maintainable, less performant and less idiomatic. The time investment for manual coding was greater but it led to a much deeper understanding of the code.
I wonder what I could have produced with vibe coding had I manually coded a reverse proxy first. Then I would have been able to guide the LLM better, and perhaps would arrive at a very similar solution. It was certainly quite impressive that I was able to vibe code my way to a working version without knowing anything about YARP whatsoever.
Appendix: Cookies, Headers, and Query Parameters
When working with reverse proxies like YARP, it’s important to understand the differences between cookies, headers, and query parameters, as each can be used for routing decisions:
| Feature | Cookies | Headers | Query Parameters |
|---|---|---|---|
| Where | Cookie header | Any HTTP header | URL (after ?) |
| Set by | Server/Client | Client/Server | Client |
| Visibility | Not in URL | Not in URL | In URL |
| Persistence | Can persist | Per-request | Per-request |
| Use cases | Sessions, auth, prefs | Auth, routing, meta | Filters, routing, data |
| Sent with | All matching requests | Only when set | Only that request |
| Path attribute | Yes | No | No |
- Cookies are small pieces of data stored on the client and sent automatically with requests to matching domains/paths. They’re often used for session management or user affinity, and can be used for routing in proxies via custom code.
- Headers are metadata sent with each HTTP request/response. They’re flexible, not visible in the URL, and are commonly used for authentication, custom routing, or tenant selection in proxies.
- Query parameters are part of the URL and are visible in logs and browser address bars. They’re easy to use for routing and filtering, but are only sent for the specific request.
In YARP:
- Header and query parameter-based routing is supported out of the box in static config.
- Cookie-based routing requires custom code in the YARP pipeline.
For API routing, headers and query parameters are most common, but cookies are useful for session or affinity scenarios.
Appendix: Prometheus and Grafana metrics
I’d wanted to learn the basics of Prometheus and Grafana for a while. I have experience with Azure, but it’s always good to know open-source alternatives. While deciding which metrics to set up, I learned about the RED and USE monitoring methodologies.
RED Method (Request-focused)
Best for: User-facing services, APIs, microservices
Focuses on:
- Rate: How many requests per second
- Errors: How many of those requests are failing
- Duration: How long those requests take
USE Method (Resource-focused)
Best for: Infrastructure, system resources
Focuses on:
- Utilization: How busy a resource is (% time busy)
- Saturation: How much extra work is queued (waiting)
- Errors: Count of error events
I also asked an LLM (Claude Sonnet 4) for recommendations on which metrics to set up. It provided a list of top 10 essential metrics. I tweaked them slightly to fit my services, but the original LLM recommendations were close.
Top 10 Essential Metrics
RED Metrics (Service Performance)
Request Rate
rate(http_requests_received_total[5m])Measures how many HTTP requests per second your service is handling. Essential for understanding traffic volume and capacity planning.
Error Rate (%)
rate(http_requests_received_total{code=~"5.."}[5m]) / rate(http_requests_received_total[5m]) * 100Shows the percentage of requests returning 5xx server errors. High error rates indicate service problems or capacity issues.
Response Duration (95th percentile)
histogram_quantile(0.95, rate(http_request_duration_seconds_bucket[5m]))Shows how long 95% of requests take to complete. Reveals performance issues that averages might hide.
Service Availability
upBinary metric showing if Prometheus can reach your service (1=up, 0=down). Critical for detecting outages.
USE Metrics (Resource Monitoring)
CPU Utilization
rate(process_cpu_seconds_total[5m]) * 100Shows CPU usage percentage over time. High CPU can indicate performance bottlenecks or insufficient resources.
Memory Usage
process_working_set_bytes / 1024 / 10241024 / 1024converts bytes to megabytes. Displays memory consumption in MB. Helps detect memory leaks and plan resource allocation. Typical ranges for .NET apps: <100MB (excellent), 100-200MB (good), 200-500MB (acceptable), >500MB (investigate).Garbage Collection Pressure
rate(dotnet_collection_count_total[5m])Tracks .NET garbage collection frequency. High GC activity can impact performance and indicates memory pressure. Typical GC rates for .NET apps: <0.1/sec (excellent), 0.1-1.0/sec (good), 1.0-5.0/sec (concerning), >5.0/sec (critical). Gen 2 collections >0.1/sec need immediate investigation.
YARP-Specific Metrics
Routing Distribution
sum by (job) (rate(http_requests_received_total[5m]))Shows how traffic is distributed across backend destinations. Useful for load balancing verification and troubleshooting routing logic.
rate()always returns per-second averages regardless of time window—multiply by 60 for per-minute or 3600 for per-hour.Proxy Latency
histogram_quantile(0.50, rate(http_request_duration_seconds_bucket{job="gateway-api"}[5m]))Measures total request duration through the gateway, including routing and backend response time. Shows proxy overhead plus backend latency. This represents user-experienced latency: gateway processing + network + backend processing + response time. Typical ranges for .NET APIs: <50ms (excellent), 50-200ms (good), 200-500ms (acceptable), >500ms (investigate).
Backend Health
up{job=~"product-service-.*"}Monitors availability of backend services behind the proxy. Critical for detecting when specific backend instances fail.
Quick Dashboard Layout
- Traffic Panel: #1, #8 (Rate + Distribution)
- Errors Panel: #2, #4 (Error rate + Availability)
- Latency Panel: #3, #9 (Response + Proxy duration)
- Resources Panel: #5, #6, #7 (CPU, Memory, GC)
Golden Rule: Start with RED for user experience, add USE for troubleshooting performance issues.
I set up these four panels in a Grafana dashboard and was happy with the result.
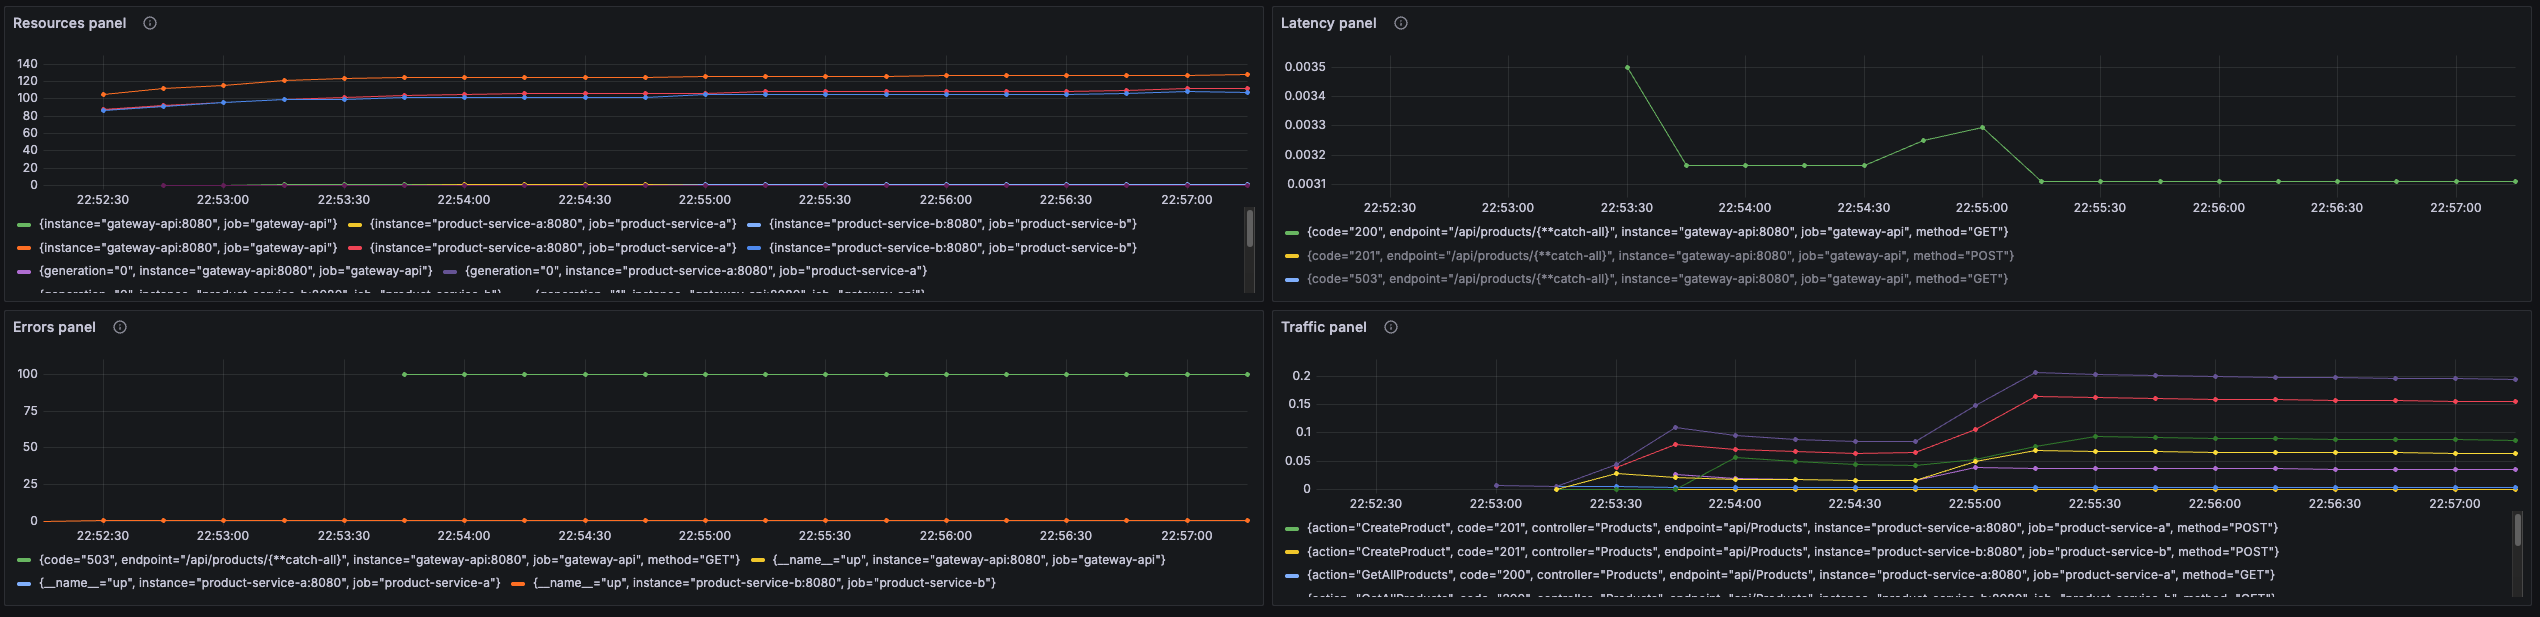 Final Grafana Dasbhoard with top 10 essential metrics according to the RED and USE methodology